Improving
Drop Nozzle and Air Blast Tomato Spraying
Alvin
Womac1, Jim Wills1,
Lee Ellis2, David
Coffey3
Tennessee
Agricultural Experiment Station
The
University of Tennessee
1Agricultural and Biosystems Engineering
2Plant and Soil Sciences Unit, Knoxville Experiment Station
3Plant and Soil Sciences Department
Abstract
Sprayer application method was evaluated throughout the 2000 season based on the amount and uniformity of tracer dye spray deposit on tomato leaves. A single-row drop nozzle sprayer and a four-row-spraying Swihart air blast sprayer applied a test dye to separate rows of tomatoes. The original sprayer setups were improved in subsequent tests by reselecting, repositioning, and reorienting spray nozzles, nozzle spacing, and an air outlet configuration.
Methods
The 92 by 120 ft plot was divided in half between no-till and conventional-till planted Mountain Fresh tomatoes. Essentially, the no-till tomatoes were stunted, so 60 ft rows of conventional-till tomatoes were used. Two six-foot spaced rows were used to evaluate a drop nozzle sprayer which had nozzles mounted on an inverted U. Four six-foot spaced rows were used to evaluate a Swihart air blast sprayer. The air blast was aimed out of the plot to not interfere with the other rows. Also, four six-foot spaced rows provided a buffer between the drop nozzle and air blast rows. Tomatoes were drip irrigated.
A liquid dye solution (ACMI #57 violet, American Coding and Marking Inc. Co., Plainfield, NJ) and 0.1 % (v/v) of ionic surfactant (Surfynol TG-E, Air Products and Chemicals, Allentown, PA) was mixed and sprayed. A constant application rate of dye (2500 mL/ac or 61.77 µg/cm2) was used for all tests and sprayers.
Ten randomly-sampled leaves per row were transported to the spray evaluation lab in the Agricultural & Biosystems Engineering Department. A 1 by 5 cm strip of leaf was cut and inserted into a test tube with 5 mL of distilled/ de-ionized water. The tube was capped and vigorously shaken to remove the dye from the leaf strip. Upon removing the leaf sample, the test tube with dye-laden water was directly inserted into a colorimeter. Dye concentration was determined based on a calibration curve. Colorimeter measurements were completed within 90-minutes of spraying to increase the ease of dye removal from the leaf. Fig.s 1 –2 show the leaf preparation and colorimeter process.
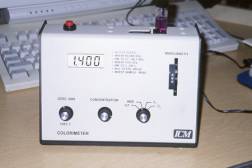
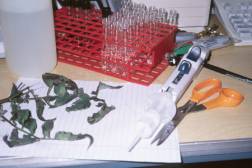
Fig.
1 Leaf preparation
Fig. 2 Colorimeter with sample
Test 1
The drop nozzle sprayer (Fig 3) had six D3-23 disc-core nozzles operated at 100 psi, 1 mph, and 70 gpa. The Swihart air blast sprayer used a low opening for the air delivery and two 8004 flat fan nozzles operated at 60 psi, 1 mph, and 20 gpa.
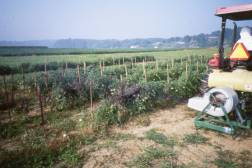
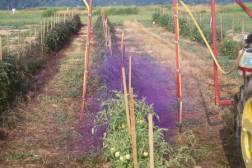
Fig. 3 Drop nozzle sprayer (D3-23 tips) Fig. 4 Air blast sprayer (8004 tips)
Table 1. Test 1 results of dye recovery. (Wind during test < 2 mph)
|
|
Drop Nozzle D3- 23 tips |
Air Blast – low discharge 8004 tips |
||||
|
Row |
1 |
2 |
1 |
2 |
3 |
4 |
|
Mean µg/cm2 |
21.9 |
23.8 |
136.4 |
73.7 |
27.0 |
23.4 |
|
% of applied |
35.5 |
38.5 |
220.8 |
119.3 |
43.7 |
37.9 |
|
CV (%) |
42.3 |
50.5 |
75.6 |
115.9 |
45.8 |
60.8 |
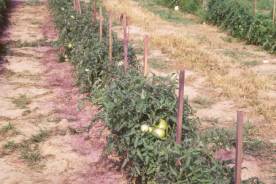 Though
the drop nozzle deposit was relatively uniform, high levels of deposit on the
ground were observed (Fig. 5). Also, high levels of dye streaking were observed
on the 1st row of the air blast plot.
Though
the drop nozzle deposit was relatively uniform, high levels of deposit on the
ground were observed (Fig. 5). Also, high levels of dye streaking were observed
on the 1st row of the air blast plot.
Fig
5. Off-target deposit on ground from drop nozzle sprayer
Test 2
The drop nozzle sprayer (Figure 6) was converted to six Albuz APG110 (.13 gpm rating @ 30 psi ) nozzles operated at 40 psi, 1 mph, and 70 gpa. The outlet on the Swihart air blast sprayer was rotated to increase the height of the discharge (Fig. 7). The air blast sprayer retained the two 8004 flat fan nozzles operated at 60 psi, 1 mph, and 20 gpa.
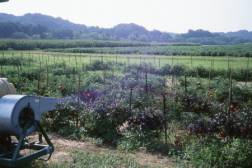
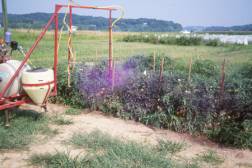
Fig. 6 Modified drop nozzle (APG110 tips) Fig. 7 Modified air blast (8004 tips)
Table 2. Test 2 results of dye recovery. (Wind during test gusting to 12 mph)
|
|
Drop Nozzle Albuz APG 110 tips |
Air Blast – high discharge 8004 tips |
||||
|
Row |
1 |
2 |
1 |
2 |
3 |
4 |
|
Mean µg/cm2 |
40.3 |
32.6 |
61.4 |
50.7 |
27.7 |
17.5 |
|
% of applied |
65.2 |
52.8 |
99.4 |
82.1 |
44.8 |
28.3 |
|
CV (%) |
39.1 |
46.9 |
77.1 |
73.9 |
50.3 |
57.3 |
Although the wind was much higher in Test 2, the drop nozzle sprayer switched to flat fan tips produced increased levels of deposit compared to the disc core tips at slightly less coefficients of variation (CV). High deposit levels (as seen in test 1) in the first row were reduced with the high discharge height of the air blast. However, high winds may have hindered the effectiveness of the air blast on all four rows, especially row 4 being most far from the sprayer.
Test 3
Later in the season a tall narrow discharge chute was obtained for the air blast sprayer. It contained 5 flooding nozzles oriented vertically – but the lowest and highest tips were plugged to increase lateral discharge of spray. Thus three Lechler 1.5 flood tips were operated at 60 psi, 1 mph, and 20 gpa (Fig 8). The uniformity of the discharge across low crop was of concern and visually examined by spraying across ground without a crop (Fig 9)
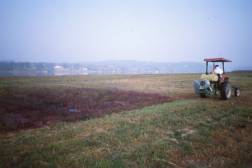
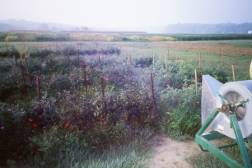
Fig. 8 New air blast discharge (1.5 flood tips) Fig 9. Uniformity without crop
Table 3. Test 3 results of dye recovery. (Wind < 2 mph)
|
|
|
Air Blast – tall discharge 1.5 flood tips |
||||
|
Row |
|
|
1 |
2 |
3 |
4 |
|
Mean µg/cm2 |
|
|
62.0 |
53.1 |
37.9 |
28.6 |
|
% of applied |
|
|
100.4 |
86.0 |
61.4 |
46.3 |
|
CV (%) |
|
|
59.0 |
52.9 |
61.2 |
63.1 |
Summary
| Deposit levels on tomatoes from a drop nozzle sprayer were increased by using fan nozzles instead of disc core nozzles | |
| Variability in spray deposit from an air blast sprayer can be improved with selection an outlet with a height similar to the height of the tomatoes | |
| Large droplets are targeted better than small ones. | |
| Relatively high levels of variability in spray deposit still exist with optimized sprayers. | |
| The impact of deposit level and variability on disease control needs further investigation. |